Learn about the two iluminr map views
Everything you need to know about the differences between All Threats and My Threats view in iluminr
Establishing the correct threat levels is critical to help understand whether a possible threat poses danger to your sites. The Threat Library drives the coloured threat activity on your map and the automated alerts sent to your people.
By configuring iluminr’s risk thresholds to your requirements, you can reduce alert fatigue and establish meaningful threat alerts for you and your team.
The iluminr Threat Dashboard displays a near-real-time view of natural disaster threats around the world. These treats are displayed under two map views.
Map Views
To navigate between the two map views,
-
Once you are logged into iluminr select the Threats tab in the main menu
-
Click the map icon in the top-left of the screen.
-
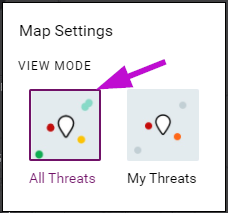
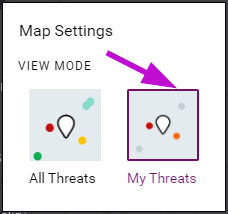
Select the map view you would like to use.
All Threats
Displays all threats and their overall severity level. This does not show the threat level in relation to your site(s).

My Threats
Shows greyed out threats on the map that are not currently impacting your sites. The threats that are within proximity to your site(s) and meet your severity threshold(s) will be colour coded by a contextual threat level. If you have set up alerts, these are likely to trigger messaging to your recipients.

Related Articles:
Need more assistance? Submit a support ticket